

A Jupyter notebook that reads the signatories of the @BarcelonaDORI, counts the signatories per country and paints the counts in a worldmap.
Repo: https://github.com/hauschke/barcelonaDORI_map
It's more or less a test of Github Actions, it updates every afternoon at 4 PM CET. 
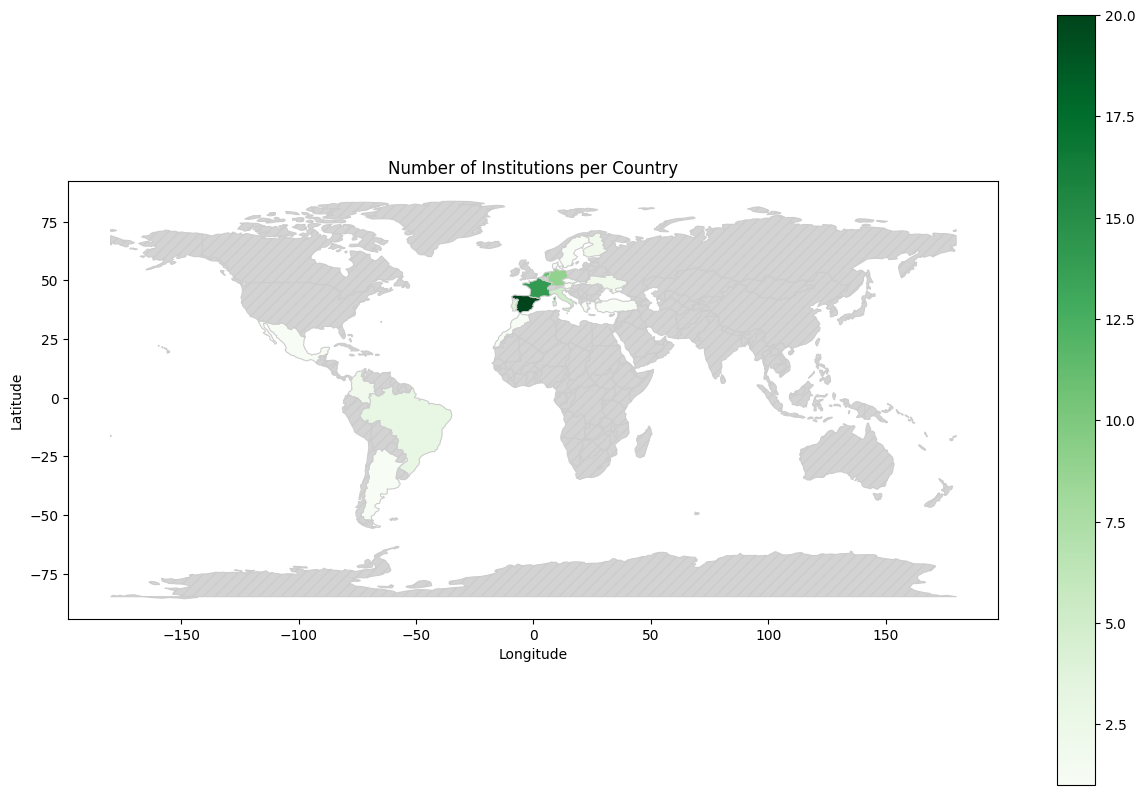

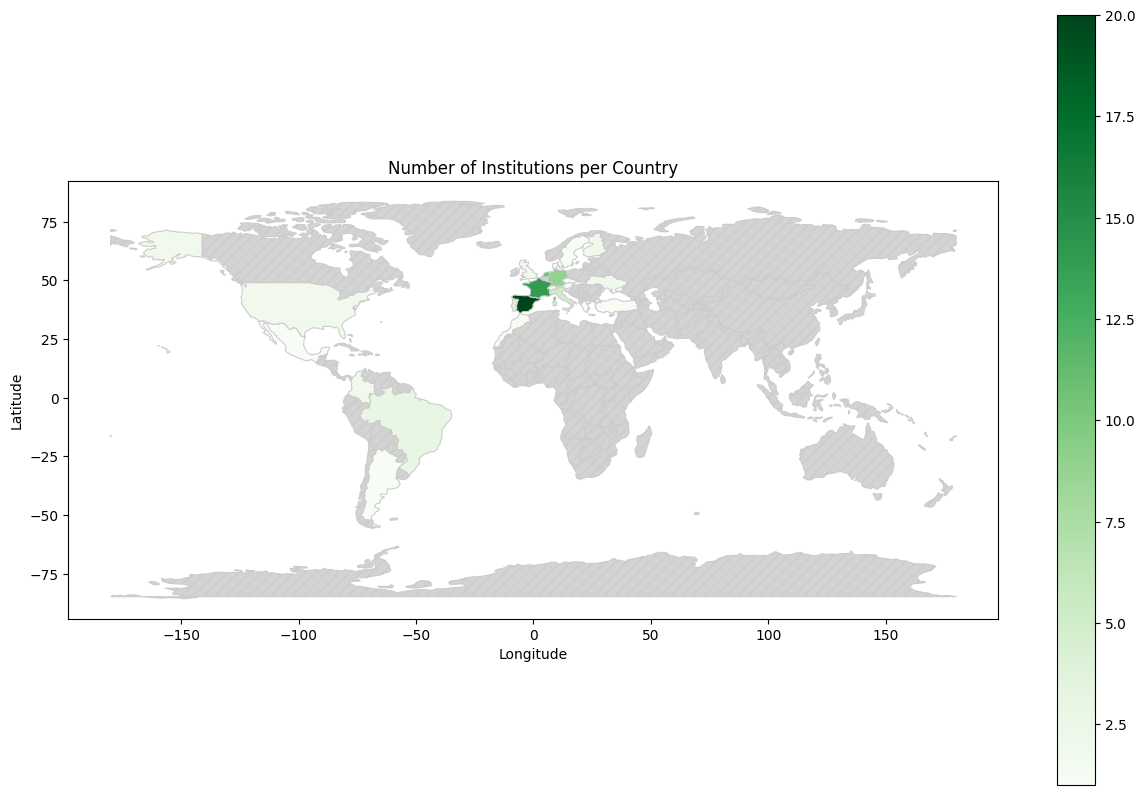
@hauschke @BarcelonaDORI Note to self. Country names on the website don't match the standard that would be picked up by geopandas (eg "UK", "US") so they appear on the graph but not on the map...adhere to standards FTW...
@hauschke @BarcelonaDORI ...aaaaaaaaand fixed (I think). Guess I have to wait until 4pmCET to see if it worked ;-)
No, I will trigger it as soon as I am St my computer! Thanks!
Hey, it works! Thanks for looking into this. Fighting with geopandas and github were my main activities in this tiny project. :)
@hauschke @BarcelonaDORI @MsPhelps Cool! You might see some pull requests over the next few days (I'll need to remind myself how to define a colormap in BD yellow...) :-)
@cameronneylon @BarcelonaDORI @MsPhelps
I can give you some permissions on this repo, if you think the map is useful.
@cameronneylon @BarcelonaDORI @MsPhelps
I added both of you as contributors, if that helps.

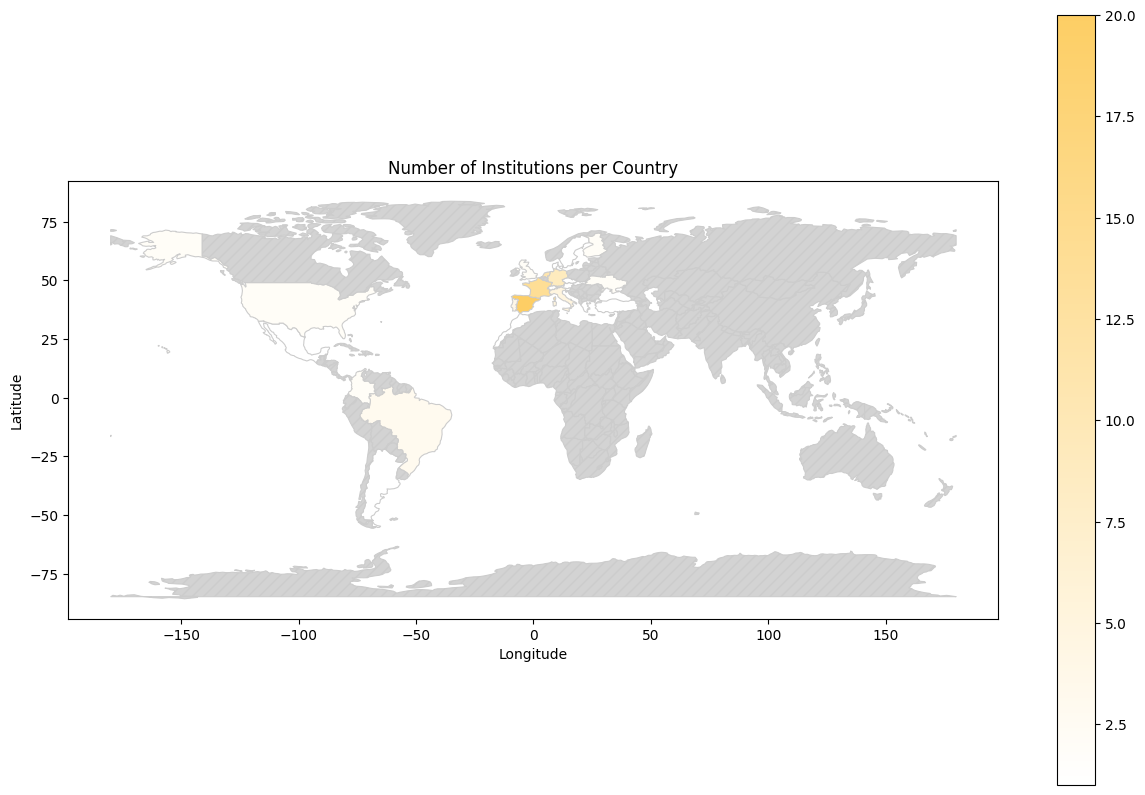
@hauschke @cameronneylon @BarcelonaDORI Thanks! I think I figured out a way to use a custom colour gradient in matplotlib for the geomap chart (working on a PR for that), but please test before merging :-)
@hauschke @cameronneylon @BarcelonaDORI
Now done in an issue instead of a PR for reasons described in the issue:
https://github.com/hauschke/barcelonaDORI_map/issues/2
(and here's the adapted notebook:
https://colab.research.google.com/drive/1YINhLbA4QbvvUIlTQFURvoCdxQu8-T1H?usp=sharing)
@MsPhelps @cameronneylon @BarcelonaDORI
I included your code, thanks!
Other changes:
* graphics export (PNG) for easier reuse
* images are now linked in readme
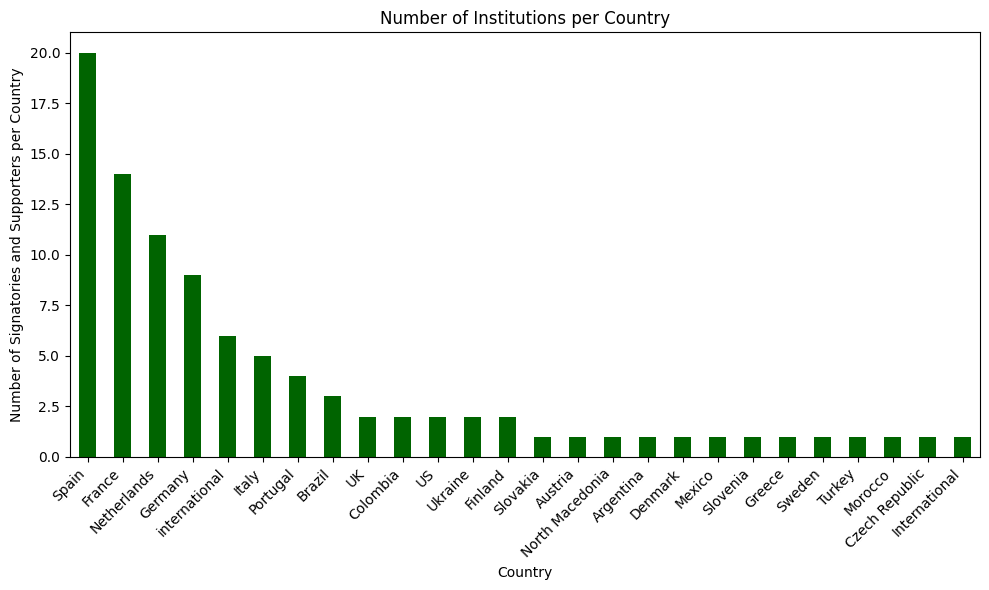
* full print of the df with the counts